The tax cut struggle isn’t just politics. Economics are at play. This graph from a recent dshort.com article illustrates the problem perfectly:
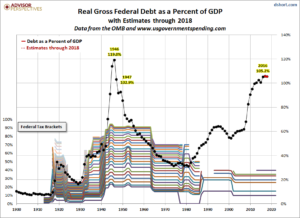
In summary, on a historical basis tax brackets are low but debt as a percentage of GDP is close to the previous peak during World War II. The red dots indicating future debt illustrate that these liabilities are not going away anytime soon, particularly as Baby Boomers begin taking Social Security and signing up for Medicare. In a recent Forbes article, Laurence Vance of the Future of Freedom foundation pointed out that both parties are committed to revenue neutral tax reform, which due to our current national debt is nothing more than rearranging deck chairs on the titanic. this debt burden is making any tax cut extremely difficult. While everyone would enjoy such a tax cut, reducing the national debt would go further towards helping future generations of Americans enjoy the same opportunities that we have benefited from.
The chart from dshort.com also illustrates the character of the greatest generation. Not only did they win the war, they also paid for the war when they came back home. As the federal debt declined, tax rates were adjusted downward from the 1960s through the 198-s. This approach made economic sense.
We now face a similar mountain of debt and it is growing. For calendar year 2016 the federal government collected 2.99trillion in revenue and spent $3.54 trillion in revenue. The debt grew by $552 billion.
It is time for both parties to be honest with us and lay out a plan to get this mountain of debt under control.
