Many of you are probably familiar with the DNA and ancestry service 23andMe.
Not only can the service tell you the ancestry of your forefathers, the company can also tell you what maladies you may inherit because of your ancestral history. They claim to have ancestral accuracy within a 0.1% variance.
So, where does the number 27 come into play?
This month according to multpl.com the Schiller CAPE Ratio clocked is above 27. Anything above 24 is considered elevated by Star Capital Research.
This is significant because studies have shown that there is a correlation between future returns and elevated CAPE ratios.
There have been few times in history where the Shiller has been this elevated. For the last thirty years, which happens to coincide with my career in financial services, the Shiller or CAPE has been above 27 for consecutive months during the following time periods:
- November 1996- May 2002
- January 2004- February 2004
- December 2006 – October 2007 (dropping to 26 for a few months during this time period)
Michael Kitces of Nerd’s Eye View makes the case that the Shiller is predictive of long term nominal returns up to 8 years.
To illustrate his case, I have charted the S&P 500 for the eight years following the beginning of the periods listed above. The results are illustrated below:
November 1996 – October 2004

January 2004 – December 2012

December 2006 – November 2014

One thing that you will notice in each graph is the extreme volatility that followed the elevated valuations. Following the tech boom and bust of the late 1990s the S&P 500 dropped over 45 percent from its market peak.
Following the housing bust and subsequent credit crisis, we witnessed the S&P 500 falling 55 percent from its peak.
Outside of the thirty year span that is illustrated, we only have one other occurrence: 1929.
Needless to say, all past occurrences of an elevated Shiller PE end with extreme volatility. As such, we consider it prudent to reduce risk during this period of historically elevated asset prices.
Is the Shiller PE the only metric showing elevated asset prices?
No. The market is considered overvalued by a number of metrics.
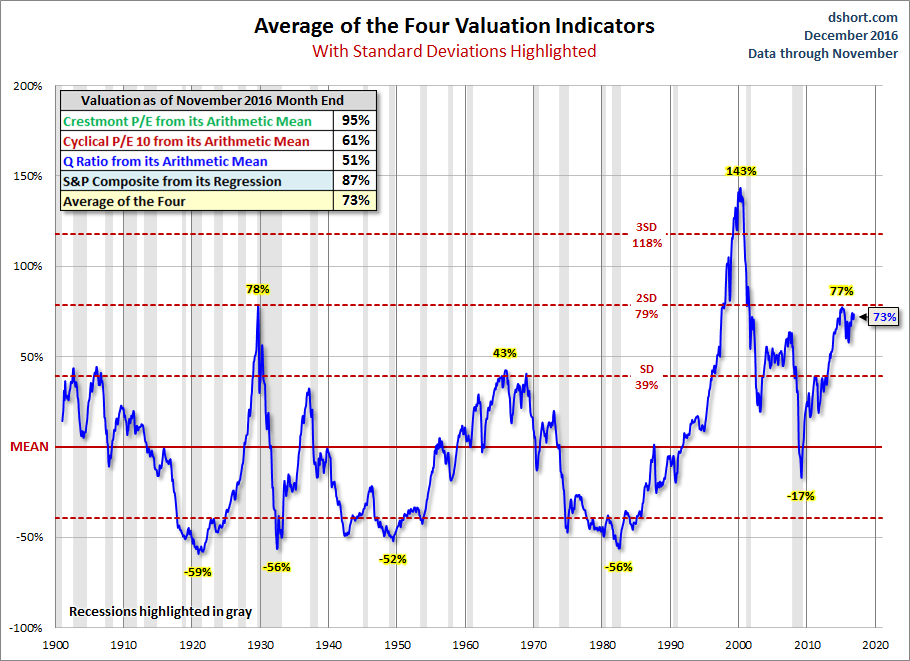
Please look at the chart below from dhort.com for the period ending November 2016. It shows a composite figure that averages four different valuation metrics, including Crestmont P/E, Cyclical P/E, Q Ratio and S&P Composite from its Regression:
While 23andMe can give us some insight into potential maladies due to genetics, market valuation metrics seem to suggest we shouldn’t take the second piece of cake.
Further References:
