With the recent Trump bump a number of commentators have suggested that we are in a Ronald Reagan market.
They suggest that we will have a second wind to this market due to the proposed decrease of regulation and taxes coupled with a hefty infrastructure bill. All of which are Reaganesque.
If you recall the Reagan years after the recession of his first term was favorable to the market.
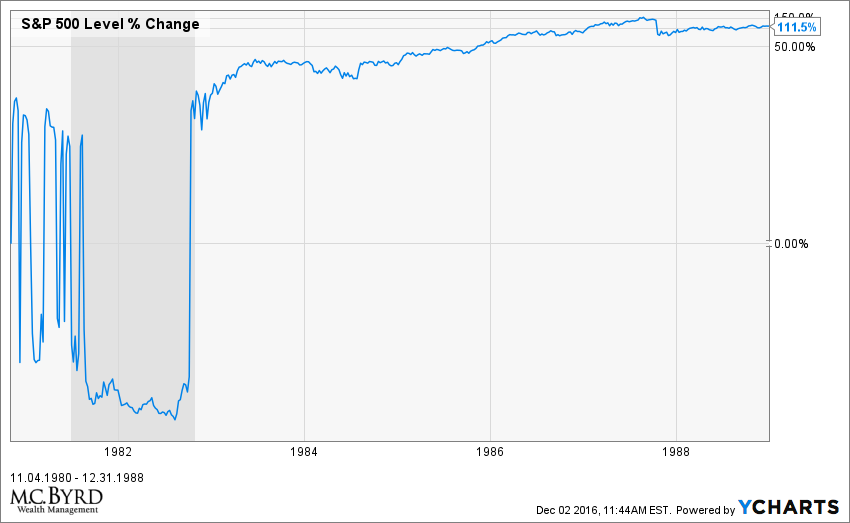
In the graph below you can see the S&P 500 index from the Election Day of 1980, November 4th through the last year of Reagan’s term, December 31, 1988. This is illustrated in the chart below. The shaded area represents the recession.
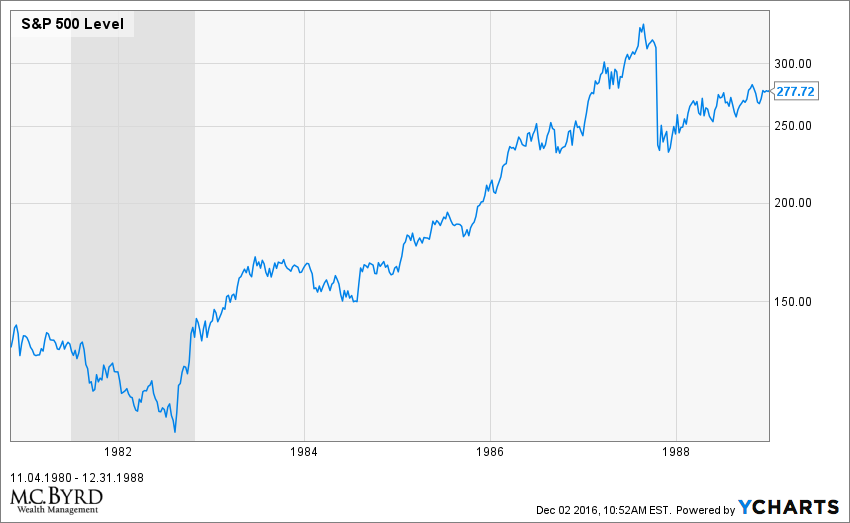
In percentage terms the S&P more than doubled during the same time period.
So why would it be difficult to replicate this type of market? There are a number of reasons.
One of the reasons is inflation. On election night of 1980, the US inflation rate was over 12 percent. When Reagan finished his last year in office the inflation rate was cut by over 65 percent to 4.42 percent.
This drop in inflation rates helped fuel an economic and market rally.

US Inflation Rate data by YCharts
The Trump administration does not have this potential as inflation is low with the expectation that it will move higher.
Valuations
The S&P 500 looked incredibly cheap when Reagan took office. According to Standard and Poors, the S&P 500 PE ratio was 9.19 on November 1st of 1980. On January 1st of 1989 the PE ratio stood at 11.82, which was still an attractive number for investing.
How does this compare to today?
On November 1st of 2016 the S&P 500 PE ratio stood at 24.14. In other words, the market is 262 percent more expensive when you compare election month of 1980 to 2016.
In fact, by numerous valuation techniques the market is pricey. We believe that, at best, this will serve as a lid on the market.
Unemployment
When Reagan took office the unemployment rate was 7.5%. After the recession the unemployment rate dropped to 5.30%.

US Unemployment Rate data by YCharts
Our unemployment rate has continued to fall from the great recession. A continued expansion of the labor market will be difficult in this stage of the business cycle which is already growing old.

US Unemployment Rate data by YCharts
Government Debt
When Reagan took office, government debt stood at roughly 42 percent of GDP. His last year in office, government debt stood at 60.15 percent.
Part of this debt fueled the military buildup that won the cold war. The increased military spending was expansionary. However debt to GDP was still below 100 percent.

US Government Debt data by YCharts
While Trump ran his campaign on a massive infrastructure spending, he does face constraints.
From 2000 to last year we have seen US debt as a percentage of GDP move from under 55 percent to 105 percent of GDP.
Pushing forward a massive stimulus project fueled by debt would be problematic and face headwinds with a Republican House and Senate. In addition, it would be inflationary which would be a headwind to any market expansion.

US Government Debt data by YCharts
Needless to say, the environment today is far different from when Reagan took office. The idea that we are in a similar place lacks the proper perspective.