During my annual physical, my physician has me count backwards by sevens to test my cognitive skills. Being in my early fifties I think this might be overkill, but the doctor’s staff assures me they are establishing a benchmark.
Counting backwards can be useful in financial markets as well. In a recent Bloomberg article journalist Lu Wang interviews Doug Ramsey of the Leuthold Group, an institutional research firm.
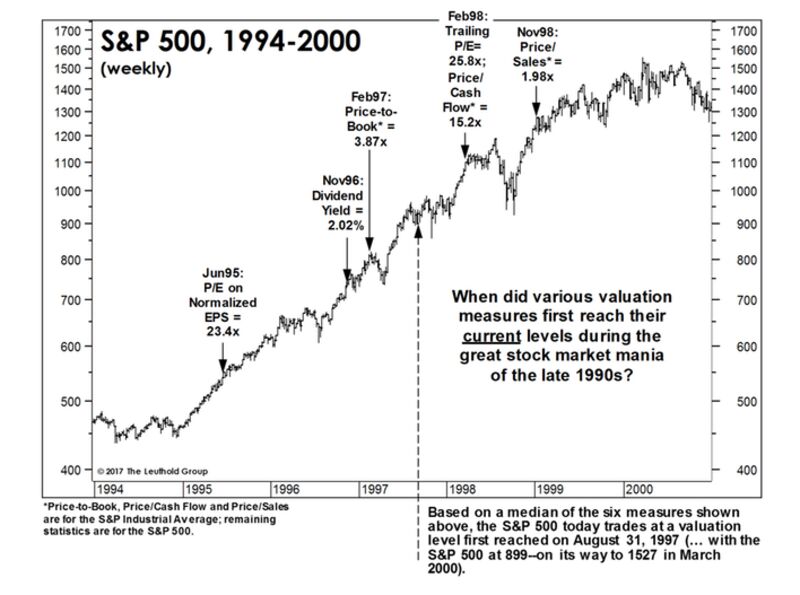
Mr. Ramsey provides an interesting chart of the S&P 500 index from 1994-2000. In the chart, he notes when the S&P 500 reached our current valuations during that time period. For example, our current price to sales ratio was attained in November of 1998.
What does this have to do with counting backwards? Let’s expand the time horizon. In the chart below, the S&P 500 index is illustrated from 1994-2013:

The Leuthold chart points out that using their six metrics we are in August 31, 1997 on a comparable basis in regards to expensiveness. Using my chart, the August 1997 price was revisited again in summer of ‘02. In other words, counting backwards the S&P 500 went back five years in price. In fact, the August price of ‘07 was not only retraced in ‘02 but also during the financial crisis of ‘08-‘09.
Riding the S&P 500 from the peak of March 2000 through March of 2013 was equivalent to treading water during a hurricane.
It is true that you cannot time the market, but you can price the market according to valuation metrics.
What was the commonality during this period? Expensive valuations. We find ourselves in the same place today.
History doesn’t repeat itself but it does rhyme. Caution continues to be our theme in investing.